Journal of the Mexican Chemical Society, vol. 61, no. 4, 2017
Sociedad Química de México A.C.
Israel Quiroga *
Benemérita Universidad Autónoma de Puebla, Mexico
Thomas Scior
Benemérita Universidad Autónoma de Puebla, Mexico
Date received: 16 June 2017
Date accepted: 05 October 2017
Resumen: Fenprocumón es un anticoagulante oral utilizado para la profilaxis y el tratamiento de trastornos debidos a trombosis. Sin embargo, si los anticoagulantes orales no se metabolizan, podrían acumularse y generar trastornos de coagulación. Fenprocumón es metabolizado por al menos cuatro enzimas hepáticas miembros de la familia de los citocromos P450; tres de las cuales son miembros de la misma subfamilia (CYP2C9, CYP2C19 y CYP2C8). Incluso con demasiadas diferencias en su secuencia de aminoácidos y estructura terciaria, CYP2C9 y CYP3A4 tienen la actividad metabólica más parecida sobre fenprocumón. En este estudio, hemos sido capaces de explicar estas similitudes en su actividad utilizando campos de fuerza de la mecánica molecular para la optimización de la geometría y energía en combinación con las técnicas de acoplamiento molecular. Los resultados fueron comparados para estudiar las Relaciones Estructura-Función (SFR) de nuestras cuatro proteínas diana (CYP2C9, CYP2C19, CYP2C8 y CYP3A4). El estudio y la predicción del metabolismo y los sitios de metabolización de cualquier fármaco se pueden realizar con éxito usando este enfoque.
Keywords: CYP450, CYP2C9, Structure-Function Relationship, Molecular Mechanics, Phenprocoumon, Docking, regioselectivity.
Abstract: Phenprocoumon is an oral anticoagulant used for the prophylaxis and treatment of disorders due to thrombosis. However, if oral anticoagulants are not metabolized, they could exacerbate and generate clotting disorders. Phenprocoumon is metabolized by at least four hepatic enzymes members of the cytochromes P450 family; three of which are members of the same subfamily (CYP2C9, CYP2C19 and CYP2C8). Even with too many differences in their amino acid sequence and tertiary structures, CYP2C9 and CYP3A4 have the most similar metabolic activity on phenprocoumon. In this study, we were able to explain these activity similarities using force fields of molecular mechanics for geometry and energy optimization in combination with docking techniques. The results were compared to study Structure-Function Relationships (SFR) of our four target proteins (CYP2C9, CYP2C19, CYP2C8 and CYP3A4). The study and prediction of metabolism and sites of metabolisms of drugs was successfully performed using this approach.
Keywords: CYP450, CYP2C9, Structure-Function Relationship, Molecular Mechanics, Phenprocoumon, Docking, regioselectivity.
Introduction
Cytochromes P450 (CYP) family is the main responsible for the first metabolism phase of external compounds of an organism (xenobiotic), like toxins and drugs 1. For this reason, the study of the activity of these enzymes has turned into one of the principal pharmaceutical industry interests. Studies of enzyme activities for different xenobiotics are amenable to In-silico approaches 2, 3, 4, 5, 6, 7, 8, 9, 10, 11, complementing experimental laboratory work results that can provide additional insight to elucidate the active binding modes for substrate-enzyme complexes 12.
Each CYP is able to metabolize a wide range of endogenous substrates and xenobiotics. Flexibility in the backbone and side chains of its active sites allows the binding of all its substrates, in a process known as induced fit 13, 14. In previous studies, it has been observed that mutations far from the active site may decrease CYPs activity, causing adverse reactions to drugs with a reduced therapeutic margin; as it is with coumarin anticoagulants 15, 16, 17, 18.
Phenprocoumon (PPC) is an oral anticoagulant inhibitor of vitamin K oxidoreductase (VKOR) widely used in many European countries, pertaining to same oral anticoagulant’s family as warfarin (WFN) and coumarin 19. Stereochemically speaking, PPC possess four isoforms 20, 21. Both oxygen bound to C-2 and to C-4 may present protonation and ionization in both types of enantiomers (see Fig. 1 in 21), being the form S-4OH-PPC the most stable in contrast to WFN and acenocoumarol, where R-forms with hydroxylation at C-4 (R-4OH-) are more stable 21. R-WFN, R-acenocoumarol and R-PPC have less anticoagulant potency and, at the same time, it is more difficult for the hepatic enzymes to metabolize the R-forms 20, 22.
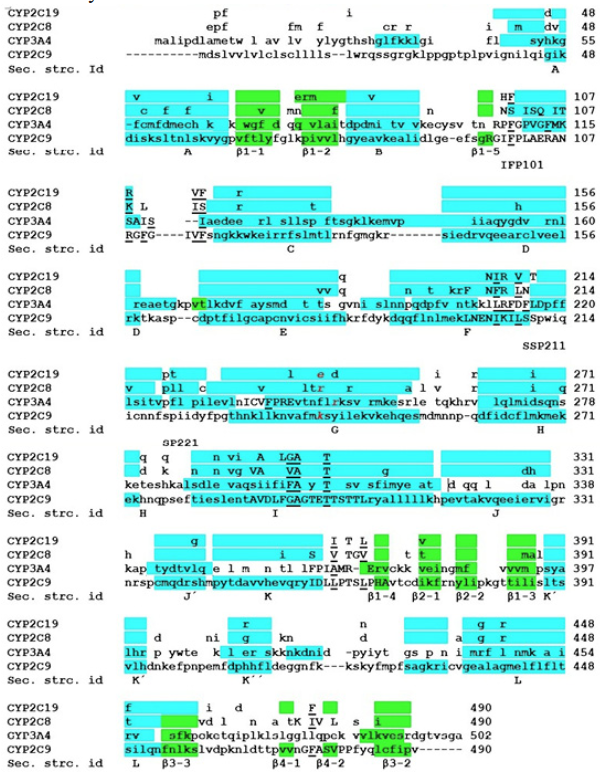
Fig. 1
The sequence of CYP2C9 is aligned with the other segments of CYPs that are responsible for PPC metabolism. The sequences are shown in one-letter lower case code. Capital letters symbolize the amino acids at the catalytic site. Underlined capital letters represent the amino acids that interact with PPC at the catalytic site. Amino acids colored in blue are part of an α-helix, those colored in green are part of β-sheets and those not highlighted are twists, turns or handles. The fifth line of each block shows the particular secondary structure of CYPs (43). The lower line to the secondary line shows some non-conserved sequences with prolines which are key residues to account for the structural and metabolic differences of the four CYPs in this study.
The coumarin derivatives PPC, WFN and acenocoumarol are metabolized in the liver by CYP2C9. However, the relative contribution of CYP2C9 to its metabolism differs between the three anticoagulants as a consequence of the differences in its structure 23. Enzyme kinetics studies determined that CYP2C9 is the main CYP in charge of the metabolism of PPC [Table 1 in 23]. Furthermore, these studies determined the three main PPC sites of metabolism (SoMs) as S-7OH-PPC, followed by S-4`OH-PPC and S-6OH-PPC. For the R-PPC form, CYP2C9 shows no clear preference for any metabolite. 20, 23, 24.
Differences in the amino acid sequence and chain length of all cytochromes P450 that metabolize phenprocumon.
Mutations at a distance of the active site could generate changes in the three-dimensional conformation of the protein, as described in the comparative analysis of the primary and tertiary structures of the CYPs in the present study. Even distant mutations can change the geometry at the catalytic site and cause specific substrate activity changes which is also the case for changes in polymorphic CYP activities. They reflect the crystal structure position of WFN far away from the canonical binding site close to the heme group at the active site (PDB code: 1OG5) 15, 16, 17. For this matter, it was taken special care when selecting crystal structures so that many complexes were sampled with a variety of liganded substrates.
PPC can be also metabolized by CYP3A4, CYP2C19 and CYP2C8 in lower rates 23, 25. CYP3A4 and CYP2C19 have similar biotransformation patterns with lower efficiency than CYP2C9, while CYP2C8 is only able to metabolize S-4`OH-PPC in similar rates as CYP2C9. The literature attests the highest activity to metabolize PPC to the liver enzyme CYP2C9 compared to the other three target CYP3A4, CYP2C19 and CYP2C8 of this study. To this end we applied multiple sequence alignment studies (MSA) to compare the four target CYPs, topology and geometry analyses of the 4 target structures, PPC docking calculations into the four target enzymes and thereafter the energy minimizations to determine the final poses between all computed solutions (clustering, scoring, and ranking after docking). The results will not only focus on the identification of the best-suited enzyme for PPC substrate biotransformation, but also on the regioselectivities. The latter describe the preferred sites of metabolism (SoM) on the ligand structure which is different for each of the four CYPs 23, 26, 27.
Material and methods
Initial structures
The crystal structures of CYPs that have been reported as the main responsible of PPC metabolism (CYP2C9, CYP3A4, CYP2C19 and CYP2C8 23, 24, 20) were analyzed. To take into account any possible induced fit phenomenon, the crystal structures from PDB 28 were prioritized: (1) wild types over mutant types; (2) liganded over unliganded complexes; (3) with the lowest volume in the cavity of its active site and (4) the best possible resolution 29, 30 (PDB codes: CYP2C9: 1R9O 31). CYP3A4: 1TQN 32, CYP2C19: 4GQS 33 and CYP2C8: 2NNI 34). For multiple sequence alignment (MSA), the amino acids sequences of crystal structures 1R9O, 1TQN, 4GQS and 2NNI were used, since it is kwon that mutations far from the active site change the geometry of CYPs.
For all unliganded CYP complexes, plausible substrate poses were computed by docking. The ligands for docking were generated with VEGA ZZ program 35, based on the crystal structure of the oral anticoagulant S-warfarin (SWF) in complex with the mutant of CYP2C9 (code PDB 10G5 36). The main metabolites reported by literature were modeled in the post- and pre-catalysis forms 20, 23, 24. Partial charges were assigned using the Gasteiger method 37.
Topology analysis
MSA and the percentage identity of all sequences were computed by BioEdit program 38. A quantitative way of comparing the geometric differences (tertiary structure) of a crystallized protein is by measuring the root-mean square distance (RMSD) that exists between pairs of equivalent atoms in proteins. Larger values refers difference in the geometries. The RMSD calculations of the backbone atoms of crystal structures were measured with VMD 39 after fitting the backbone atoms. Visualization of regions with higher RMSD from the enzymes was also performed with VMD. The inspection of the active sites and near-by regions were performed with Discovery Studio 4.0 Client program 40.
Docking analysis
By substrate docking into PPC we differentiated two models: the aforementioned pre- and post-catalysis stages. Docking was performed in order to generate plausible substrate poses of PPC in the enzymes´ active sites that metabolize it, namely: CYPs 2C9, 2C19, 2C8 and 3A4.
Docking calculations were done in two steps: first was the search for the lowest energy geometry for each complex with Autodock 4.2 (AD4) 41. The second step consisted in the refinement of those positions with the program Yeti 8.4 42 whose force field contains parameters of the metal bonds for iron atom in heme group.
In the first step prior to docking, all ligands were prepared using Vega ZZ tools 34. Partial charges were calculated by Gasteiger method 37 and we used TRIPOS force field to select atom types. Under AD4 we centered the box grid on the chiral carbon of PPC and the box size was 40x70x40 due to active site shape of CYPs. Docking parameters were 256 runs of genetic algorithms with a population size of 150 and 25000000 of maximum number of evaluations. Other parameters were default. The valid final positions of the ligands were those with the highest energy affinity and maintaining hydroxylation geometry (4.9 Å between iron and SoM, 2.5 Å between the iron and the distal ligand and 3 Å between the distal ligand and SoM) 29, 30.
Final energies were obtained after collecting the docking solutions and selected the lowest energy solutions as final poses during an iterative process of force field minimization by Yeti 8.4. Yeti’s force field constitutes an AMBER force field extension. We assigned AMBER atom types and calculated partial charges in Yeti 8.4, by the Gasteiger method 37, 42. Minimization included a full refinement of 150 cycles with 2.0 Å “cutoffs on” and default values “cutoffs out”.
Once the main positions (or poses) of the metabolites were obtained under Yeti. All ligands were rotated on the binding axes between the carbon - oxygen bonds of the complexed substrates and the hydroxyl group added. A new position of the metabolite was obtained at the active site every 24°, giving 15 new positions for each of the three major metabolites. The new positions were further refined with the Yeti program.
Results
Topology and geometry analyses
MSA study was performed to identify the location of the different amino acids that metabolize PPC and to measure their percentage identities of their sequences (Fig. 1 and Table 1). The cytochromes P450 tertiary structure is well characterized (see Figures 1 and 2 in 43). Thus, it was possible to observe how these differences change the three-dimensional (3D) geometries of these enzymes. The catalytic site amino acids are shown in capital letters in Fig. 1, whereas those having direct interaction with the substrate at the catalytic site are underlined and given in capital letters. The amino acids in red belong to the entrance to the active site and their importance in the recognition of the type of substrate has been measured 44. CYPs sequence compared with CYP2C9 are shown partially, only placing the amino acids that differ from the CYP2C9 sequence. At the bottom of each sequence are shown non-conserved prolines identified as the main responsible for changes in the three-dimensional structure of the studied CYPs. The presence of prolines causes kinks or turns in the backbone geometry 45. The α-helices and the β-sheets appear in blue and green, respectively. Line 5 of each block shows the identification of each secondary structure. The sequences of CYP2C9 and CYP3A4 are shown in lines 4 and 3, respectively. In these lines the large differences in the amino acid sequences of these two enzymes can be clearly seen, even in the amino acids with direct interaction with the substrate at the catalytic site (capital letters and underlining), which was not expected due to the similar activity that both enzymes have on PPC. The differences between the sequences of CYP2C9 and CYP2C8 lie mainly in the amino acids of the catalytic site. On the other hand, the differences in the amino acid sequence that CYP2C9 has over CYP2C19 are found in remote areas from the catalytic site.
Fig. 2 displays the graph of the RMSD results between the backbone atoms of the amino acids. It is observed as the region between amino acids from 200 to 250, region corresponding to the active site of the F and G loops of CYP2C9, are the zones with the highest RMSD, and it is very likely that the induced fit of these enzymes is carried out in this region. Fig. 3 shows the overlap of the enzymes that metabolize PPC and highlights in red areas with higher RMSD. Table 2 summarizes the general quantitative comparison of the differences in primary structure (percentage of sequence similarity) and tertiary structure (RMSD). CYP2C9 and CYP3A4 are the enzymes with the highest RMSD in their geometry; this finding might not be surprising due to its low percentage identity. However, as mentioned before, it is necessary to emphasize that both enzymes have hydroxylation patterns and similar production efficiency on PPCs. CYP2C9 has greater geometric similarity (lower RMSD) with CYP2C8 than with CYP2C19. This is surprising because CYP2C9 is approximately 14% more similar in sequence to CYP2C19 than CYP2C8. A plausible reason is that the largest differences in amino acid sequence between CYP2C9 and CYP2C8 are found in the amino acids that make up the active site cavity and not in other structural regions such as detected in CYP2C19 (Figures 1, 2 and 3).
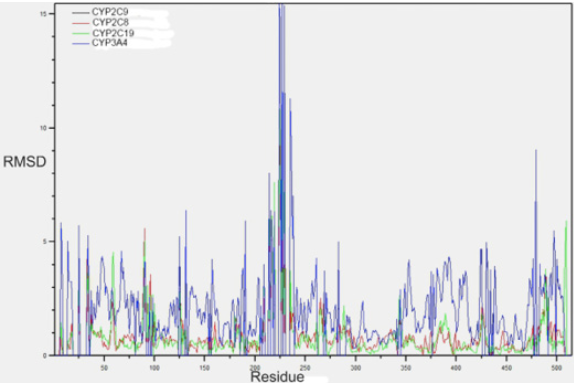
Fig. 2
RMSD plot for the atoms of amino acid-to-amino acid backbone of the CYPs enzymes 3A4, 2C8 and 2C19 with respect to CYP2C9. The black line of CYP2C9 is not seen since its RMSD is 0.
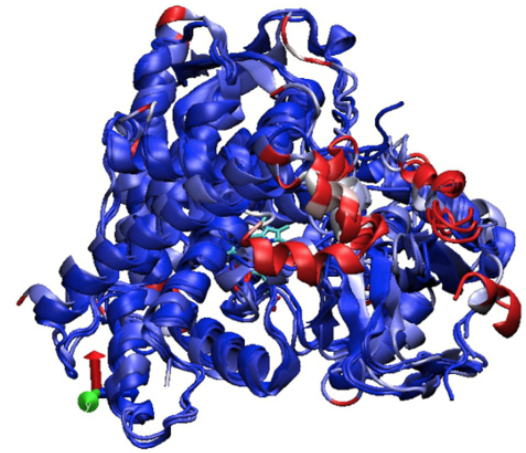
Fig. 3
Superposition of CYPs 2C9, 2C8, 2C19 and 3A4. The zones of higher RMSD and differences in the structure of enzymes are displayed: in blue, the zones with lower RMSD and in red greater RMSD.
Comparison of RMSD and sequence identity of CYPs that hydroxyl to PPC. We compare the RMSDs (in parentheses) between the structures of the CYPs. Their coefficient of similarity for their sequences is shown.
Figures 1, 2 and 3 together with Table 2 prove that changes in the amino acid sequence in areas far from the catalytic site generate considerable changes in the tertiary structure and activity of this type of enzymes. This becomes even more evident in the amino acids corresponding to positions 101, 211 and 221 in CYP2C9. These positions correspond to prolines located at the starting points of sequences corresponding to the B-C loop, which participates in the recognition of the substrate and is part of the entrance to the catalytic site, and the FH loop, region that joins two α-helix that form part of the site active. In addition, the amino acids before these positions are not conserved (Fig. 1). It should be noted that in CYPs 2C8 and 2C19 there are two small α-helix between the α-helix F and G. Even so, the P221 mismatch in CYP2C9 preceded by S220 may be responsible for the enzyme having a loop instead of two α-helixes in this region (Figures 1 and 3).
Changes in the amino acid sequence of the active site of CYP2C8 relative to the other CYPs of the 2C sub-family appear responsible for the fact that this enzyme can only metabolize PPC at the 4’carbon. Its geometric similarity with CYP2C9 could cause the production performance of the 4’OH-PPC metabolite to be similar to that of CYP2C9 on this same metabolite 23. Yet, the function of the amino acids interacting directly with the substrate at the catalytic site should not be neglected. These residues could influence the selectivity of SoM and substrate type, as in the case of CYP2C8 and CYP2C19. These enzymes are very similar in tertiary structure (RMSD: 0.89), but their differences in the amino acid sequence of the catalytic site cause them to metabolize substrates of different chemical characteristics.
Fig. 2 shows the RMSD of the backbone of each amino acid that CYPs 2C19, 2C8 and 3A4 are in relation to CYP2C9. The areas of greatest structural variation of the backbone in all four CYPs are close to the N-terminus as well as C-terminus and those corresponding to mobile loops with variable secondary structures. And at sites close to amino acids 100 and 220, which represent the zones corresponding to the B-C loop and the α-helix F and G. A large geometric variation between CYP3A4 and the rest of CYPs in the area is also recognized in the corresponding CYP2C9 as part of the active site close to the amino acid aPhe476.
Fig. 2 and the superposition of the crystal structures of CYPs 2C9, 2C8, 2C19 and 3A4 in Fig. 3 show the regions of least geometrical similarity between these enzymes. As expected, the major geometrical differences are located at the catalytic site and at the B-C loop, observed previously in CYPs of the 2C sub-family in the study 33. The subtle differences in the primary structure of the enzymes of the 2C subfamily change the geometry of the active site, causing the amino acids in this region to have a different distribution in space and to interact in a particular way with their respective substrates.
The position corresponding to Ile99 of CYP2C9 constitutes the very same spot that marks the beginning of the B-C loop, and as shown in own MSA, is a non-conserved amino acid in the three CYPs (Fig. 1). Based on this result it can be inferred that amino acid constitutes the major responsible for the structural differences in the B-C loop. A similar effect occurs at the end of the α-helix F, where there are considerable differences in the amino acid sequences of these enzymes, which provokes a remarkable change in the geometries of the backbones and in the arrangements of the side chains of the consecutive amino acids.
Upon superposing the crystal structures of CYPs 2C9, 2C8, 2C19 and 3A4 it became evident that the geometrical variations of these enzymes were caused by differences in their amino acid sequences. The B-C loop and the α-helices F and G are the areas of greatest structural variability in CYPs that metabolize PPC (Fig. 3). Coincidentally, in those areas there are the largest differences in the amino acid sequences of CYPs 2C9 and 2C19 (Fig. 1).
It should be noted that, although the primary and tertiary structure of CYP3A4 and CYP2C9 do not have great similarity, both metabolize WFN and PPC with very similar patterns and efficiency. While CYP2C8, which shares great similarity in the sequence with CYP2C9, is barely able to metabolize WFN with low performance 46, it is not able to metabolize R-PPC, and only metabolizes S-PPC to C4 ‘ 23.
Chemical composition and space arrangements at the active sites
Comparisons were performed on behalf of the three-dimensional models of the amino acids forming the active sites and interacting directly with the substrates in the cavity of the 4 CYPs that metabolize PPC. Table 3 summarizes the results of those comparisons. Residues that interact directly with the substrate in hydroxylation geometry have red letters, second-order residues that limit the active site have green letters, and the residues written in black belong to a group which does not possess direct interaction with the substrate but occupy the same positions in three-dimensional space of another residue with green or red labels in other CYPs.
Comparison of the amino acids present at the catalytic site of CYPs 2C9, 3A4, 2C19 and 2C8. In red are shown the amino acids that interact directly with PPC in the active site, in green those that partially participate in the interaction with the substrate in the cavity and in black those that are occupying the space of certain amino acid of another enzyme CYP.
The active site composition analysis of CYP2C9 and CYP2C19 provides an interesting case, because both sites share great similarities in primary and tertiary structures. CYP2C19 is not able to mimic the performance that CYP2C9 has on PPC. The most notable difference is in the spatial arrangement of amino acids at the active site. In spite of having the same composition, the residues that interact with the substrate are not the same and are placed in different positions, which causes that the binding energies or affinities for PPC are remarkably different.
As already reported, the major differences in the primary structures (i.e. the amino acid sequences) between CYP2C9 and CYP2C19 relative to CYP2C8 are localized in those amino acids that belong to the active sites 33. This explains, in part, the dissimilar activities of CYP2C8 and CYP2C9 on PPC. CYP2C8 has polar amino acids in this region, which allows the formation of hydrogen bonds with their natural substrates that are polar and larger than those of CYP2C9 and CYP2C19. On the one hand, the substitutions of L362 and L366 of CYP2C9 by V362 and V366 in 2C8 causes an increment in the volume of the cavity, all of which explains how the substrates of CYP2C8 are connected to its catalytic cavity. On the other hand, however, the catalytic sites of CYP2C9 and CYP3A4 share great similarities on their chemical composition. CYP3A4 is rich in phenylalanine residues and contains a positively charged residue (Arg212), while CYP2C9 contains three phenylalanine moieties, four long chain aliphatic amino acids (isoleucine or leucine) and one arginine (Arg109), characteristics not shared with both, CYP2C19 and CYP2C8 (Table 3).
Looking deeper into the catalytic site of CYPs 2C9 and 3A4, we can see how some amino acids of CYP3A4 that do not connect in an MSA to those of CYP2C9 overlap in the three-dimensional geometry of the active site. Phe215 of CYP3A4, located in the F-G loop region, occupies the three-dimensional site of Phe476 in CYP2C9 and CYP2C19; Ile476 occupies in CYP2C8 this place.
Although Arg108 of CYP2C9 and Arg212 are located in different spatial arrangements at the active site of their respective enzymes, both are members of a loop (Arg108 of the B-C loop and Arg212 of the GF loop), interacting directly with the substrate in the catalytic site and have been reported as amino acids involved in the affinity that the enzymes have on anionic substrates 31, 32. In addition to the similarities exhibiting CYP2C9 and CYP3A4 at the active site, it is noteworthy that the conformations of amino acids change (side chain rotatations) when they interacts with the substrate. Residue Arg108 of CYP2C9 occupies the equivalent position in space as Phe241 of CYP3A4. In addition, residue Phe114 of CYP2C9 is in the position of Ile120 in CYP3A4 and Ile205 of CYP2C9 occupies the spatial location of Arg212 in CYP3A4. We prove that the effect that could have the differences in sequence and RMSD at the activity that both enzymes have on PPC are fairly diminished (Fig. 4).
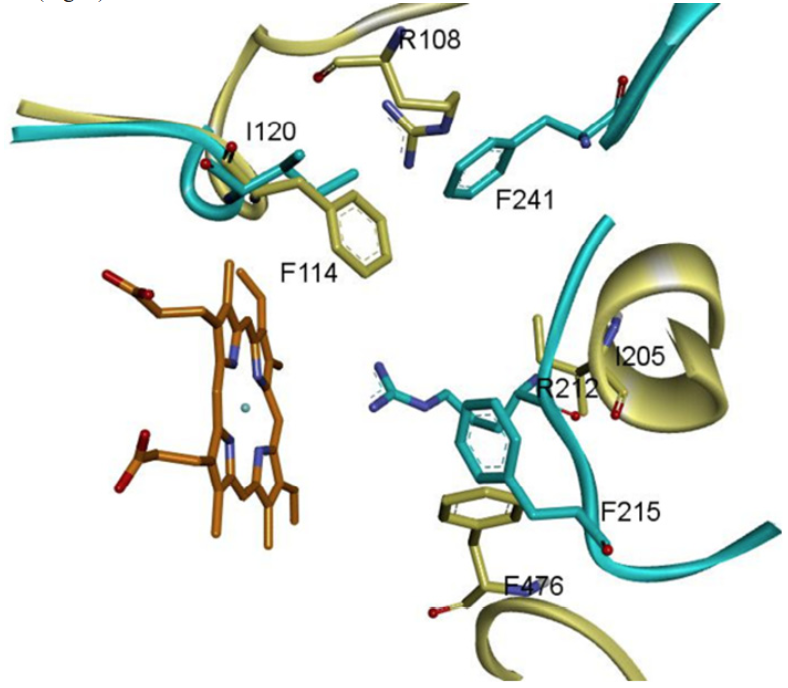
Fig. 4
Three-dimensional arrangement of the superposed amino acids of CYP3A4 (blue) and CYP2C9 (yellow) at their catalytic sites. Even not corresponding in a sequence alignment, the three-dimensional superposition make these residues equivalent the active sites of the enzymes. To the bottom left the heme group (orange) is the core part of the catalytic site of both CYPs, and its structure and function is completely conserved in the same location.
Rotation of the aforementioned residues at the active site of CYP2C9 and CYP3A4 reflect the similarities in metabolism and regioselectivity that both enzymes have on PPC, as well as the great structural difference that is measured in their RMSD. Especially in the region corresponding to Phe476 in CYP2C9, where CYP3A4 Phe215 occupies the three-dimensional position of this residue (Fig. 2). In addition, it explains how these differences do not affect the similar activity that both enzymes have on the PPC (Figures 1 and 4, Table 2).
Composition of the B-C loop
The B-C loop is part of the entrance to the catalytic site and plays a fundamental role in the recognition of substrate molecules (see Figures 1 and 2 in 43). The composition of this loop in a considerable number of CYPs has been characterized in previous works, revealing that the hydrophobic amino acids are those that have greater incidence 43. In the case of CYPs that metabolize PPC and other coumarin-based anticoagulants, the presence of ionized and polar amino acids decreases in aliphatic and phenylalanine residues. The results of the percentage composition of the amino acid types in this loop are shown in Table 4. Here one can observe the affinity pattern that these enzymes have on the type of substrate that they metabolize with better efficiency. PPC is a hydrophobic and at the same time ionic substrate. Therefore, it is expected that the enzymes that better metabolize this substrate present good characteristics in the B-C loop, which can be seen in Table 4. The CYP enzymes with an elevated percentage above 70% of aliphatic or phenylalanine amino acids are CYP2C9, CYP3A4 and CYP2D6. Enzymes with a percentage of up to 15% or more for ionic residues were found: CYP2C9, CYP3A4, CYP2C8 and CYP2C19 (Table 4). Of the enzymes that metabolize oral anticoagulants, CYP2C9 and CYP3A4 share both percentage compositions of these types of amino acids. These two enzymes present better performance on the metabolism of PPC. Our models explain in details at an atomistic scale the differences between the structures and the catalytic activities for CYP2C9 and CYP2C8, all of which relates to merely 50% of the aliphatic residues and a fairly high proportion of polar amino acids in the B-C loop (Table 4).
Percentage composition of the types of amino acids present in the B-C loop of the CYPs in charge of coumarin anticoagulants metabolization.
Entrance to the active site of CYP450 enzymes
A crucial area in the recognition of the substrate is the surface end of the α-helix G 31. Like the B-C loop, the outer face of the α-helix G forms part of the entrance to the catalytic site of the CYPs. It has been reported, through site directed mutagenesis studies, that Arg241 of CYP2C8 confers it preferences for anionic substrates to this enzyme (44, 34). This amino acid is not conserved in CYPs capable of metabolizing PPC. CYP2C19 possesses a cationic amino acid at this position (Glu241) that could provoke repulsion on the PPC substrate, which is of the same cationic nature, explaining the low metabolic efficiency that CYP2C19 has over PPC compared to CYP2C9, having a lysine at said position (Lys241). In CYP3A4, residue Phe113 belongs to the B-C loop. It is occupying the space that in the other three CYPs correspond to amino acids with number 241. Nonetheless, it also has an arginine (Arg250) nearby. Positively ionized amino acids at this position facilitate the entry of anionic substrates into the catalytic site of these CYPs (Fig. 5). The amino acid composition of the ligand entrance constitutes a pivotal factor that must be taken into account when discussing the affinities (binding energies) of the substrates. The chemical composition of the B-C loop and the external face of the CYP2C9 α-helix G are critical. The electrostatic repulsion between Glu241 of CYP2C19 on the outer vestibule of α-helix G and PPC causes the performance on PPC to be lower for CYP2C19 than that of CYP2C9 (Fig. 5).
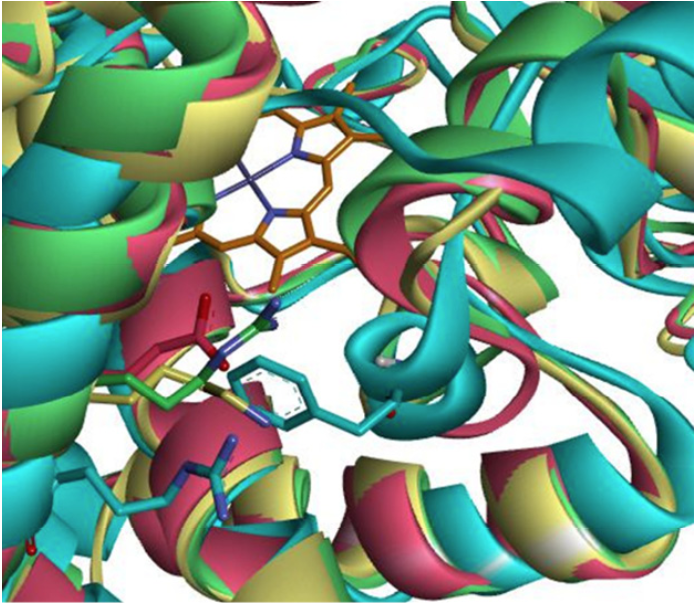
Fig. 5
Amino acids of the enzymes CYP2C9 (yellow), CYP3A4 (blue), CYP2C19 (magenta) and CYP2C8 (green) corresponding to equivalent position of R241 of CYP2C8. In the background the heme group is observed in gray, while the amino acids of the respective enzymes are illustrated by the color of the enzyme. It can be seen how F113 of CYP3A4 is located at the position corresponding to the amino acids of 241 of the other enzymes whereas R250 is oriented toward the opposite direction to the catalytic site. Helix G (foremost “spiral” on the left side forming a diagonal line from bottommost left to uppermost left corner) contains the key amino acids (blue and green Arg of CYP3A4 or CYP2C8, respec-tively; magenta Glu of CYP2C19, and yellow Lys of CYP2C9).
Docking between PPC and CYP 2C9, 2C19, 2C8 or 3A4 targets
The PPC docking assisted the identification of the interacting side chains of amino acids at the active sites of the non-hydroxylated (pre-catalysis) and hydroxylated (post-catalysis) stages (Table 3). Moreover, the results of docking calculations show no preference for some enantiomeric form 23. This is not surprising if the final conformations of docking are analyzed. The positions of the ligands at the active site is very similar to one another regardless of enantiomers Fig. 6.
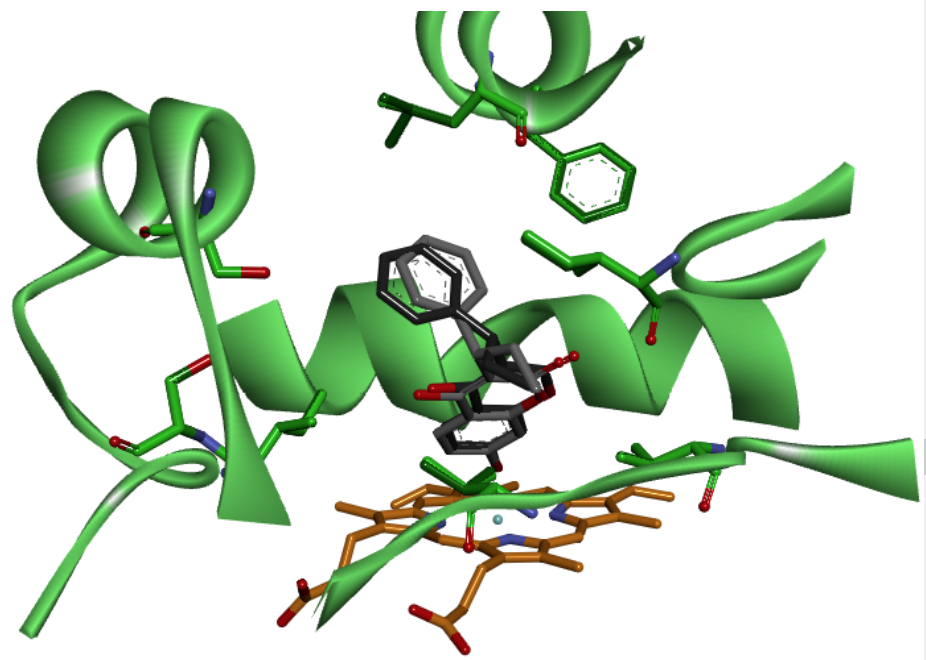
Fig. 6
C-7 metabolite of R-PPC (black) and S-PPC (gray) have very similar position and orientation at the active site of CYP2C8 (green). In the bottom the heme group is observed in orange, while the amino acids with direct interaction with substrate are illustrated by the color of the enzyme. Both R-PPC and S-PCC forms interact with the same amino acids at the active site of CYPs enzymes.
The huge cavity volumes of the CYPs 34, 31, 33 cause that enantiomers or certain SoMs have no energy preferences over CYPs. The distances between carbons 6 and 7 of PPC are very short and do not vary much (for the matter of Brownian thermal movements), making the differences between the energy minima and the geometries at the active site of the ligand for the hydroxylation of these carbons almost insignificant (for the matter of measured values). Similarly, all the interactions of the hydrophobic residues of the CYPs in the cavity with the phenyl rings (either the phenyl group or the coumarin scaffold) and the orientation of the PPC oxygen atoms, act in the same way so that the interaction energies for the carbon 4’ is similar to those for SoMs 6 or 7. On the other hand, the methyl group is placed in the space occupying the phenyl group of the opposite enantiomer (in the case of SoMs 6 and 7) or can occupy the same spot but in mirror-like orientation (in the case of SoM 4`) providing a maximum difference of 7 kilocalories per mol in the docking results (Fig. 7).
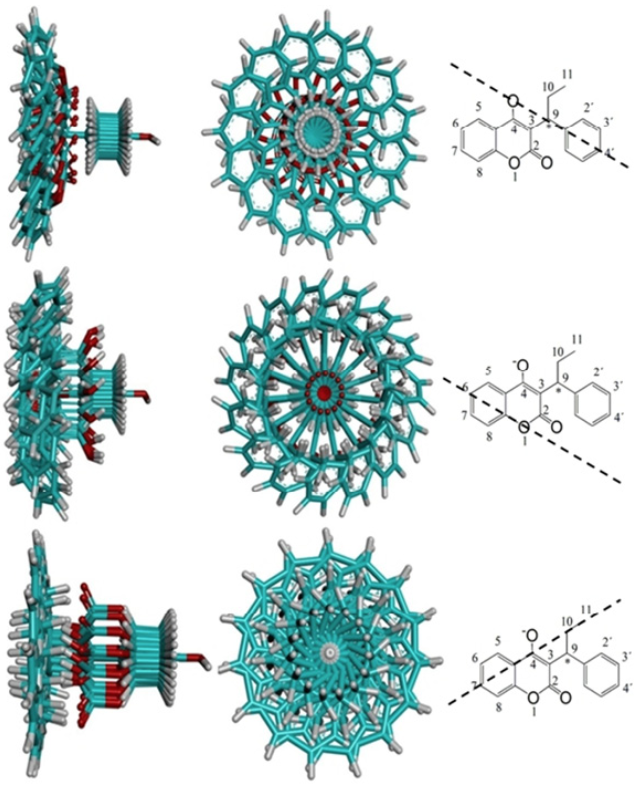
Fig. 7
Superposition of the 15 ligand positions of PPC corresponding to the hydroxylation at C-4’ (above), C-6 (in the middle) and C-7 (below) after rotating the final solution from Yeti FF. To the right of each overlap the axis is shown on which it was rotated to the final position of the refinement ofthe three major metabolites, C-7, C-6 and C-4’. The axis corresponds to the geometry of the C-OH bond of the added hydroxyl group.
Our results show that the computed interaction energies between CYPs and PPC are relatively constant regardless of the hydroxylation pattern. This means that the preferences and regioselectivities concerning the experimentally observed metabolic activities of the studied CYPs cannot be reproduced by molecular mechanics-based docking (Table 5). It is save to utter that our approach can be generalized and applied to to other CYPs as well. Crucial is the tradeoff dealing with computer resources (time and limited capacities) to keep any simulation as simple as possible. So molecular mechanics approaches are used, but the models may suffer in electronic description to reproduce the precise activity of such enzymes. Their biological activities are based on subtle electronic and steric effects which cannot be handled by molecular mechanics docking based on predefined standard atom types and electron configurations.
Interaction energy between CYP2C9 and the major PPC metabolites rotated on their own axis. In green are underlined the results that retain the hydroxylation geometry after energetic refinement, in red are those whose position does not have hydroxylation geometry.
Nevertheless, we achieved our goal to correlate computed interaction energies between relevant atoms with experimentally observed CYP activities, but we did not study the electronic behavior of the atoms which are responsible for the specific hydroxylation patterns, or the reaction mechanisms. Our findings in general are not surprising if one takes into account that the rotation of the ligand on its own axis at SoM C-7 occupies less volume than the rotations at SoMs C-4 as well as C-6 (Fig. 7). The latter showed an increase in discrete (rotated) positions, all of which augment their possibilities to produce 7-OH metabolite of PPC. The active site of CYP2C9 forms a cavity wide enough to allow the aforementioned rotated positions at SoM C-7 to maintain favorable contacts for C-7 hydroxylation.
As reported in 34, cavity volume plays a determining role in the preferences that CYPs have over the substrate type. The results of Table 5 show that after rotating the ligand in hydroxylation geometry on its own axis the C-7 SoM retains a greater number of positions than would allow its hydroxylation. Table 5 reflects that the protein - ligand interaction energies of the rotated ligands conserve favorable geometries both in the pre- and post-catalysis stages and their values are mainly invariant. Apparently, once that the substrate is placed into its hydroxylation position, the binding affinities for this ligand pose stem from the same interacting amino acids (Table 3).
Discussion
For the regioselectivity we found that the main driving force is a matter of “space” to accommodate the ligand close to the heme site. Next are the amino acid side chains which determine the chemical feature in the binding regions, for example one CYP prefers charged substrates over more nonpolar substrates thanks to ionic site chain groups (Arg250 and Arg241 of CYP3A4 or CYP2C8, respectively; Phe113 of CYP3A4, Glu241 of Cyp2C19, Lys241 of CYP2C9 Fig. 5). Certain residues are equivalent in sequence position but they are different side chains, while others are equivalent in function (cations, anions, hydrogen bonding partners) but not in sequence positions (Fig. 4). Only when comparing residues the side chains of which coincide in space (i.e. occupy the same spot) could be correlated into a structure-function relationship (SFR). That nicely explains the functional state of each of the four CYPs, all of which accounts for the differences of their regionselectivity facing the very same substrate PPC. Our computed assessment of CYP2C9 as the strongest PPC metabolizer were corroborated with the known facts about CYP3A4 which is the preferred metabolizer of the more common WFN substrate among these four CYPs. When we look for the known atomic and geometric reasons why CYP3A4 most intensively metabolizes WFN, we could apply these features (or criteria) to the PPC case. Our synopsis of the results here ought not to overlook the influence of the substrate with a two-fold impact: (1) geometrically, the smaller size than WFN or acenocoumarol makes PPC amenable to C-7, C-6 and C-4’ hydroxylation by all four CYPs. (2) Chemically, the absence of a ketone or nitro group (seen on WFN or acenocoumarol) not only allows a larger access to the heme site of all CYPs, but also influences at large the reactivity through electronic effects.
Other crucial factors are the steric requirements for substrate atom hydroxylation (SoM). Moreover, analysis of SFR data showed that with more room to access the heme center the chances for successful hydroxylation was increased. This was evidenced by a larger number (clustering) of energetic and geometrically favorable ligand poses during docking. The theoretical findings about the preferred SoMs were confirmed by numerical data about hydroxylation patterns from enzyme kinetics experiments. Hence, computed as well as laboratory values coincide in the SoM preferences (regioselectivity) of the CYP2C9 enzyme which has the highest rate of PPC metabolism.
Intriguingly, we found that the best metabolizer CYP2C9 was followed by CYP3A4 which definitively has a distinct geometry and amino acid sequence 47. Functionally equivalent side chains did not stem from residues in the same sequence position (poor similarity or homology), albeit coincide in chemical and spatial properties of the binding cavity. Our findings allow a tree-fold explanation: (1) we were able to understand on a molecular level why CYP2C9 and CYP3A4 act as strongest metabolizer for PPC, (2) despite of their extremely low amino acid sequence identity, followed by vast tertiary structure changes, and that combined with (3) why certain atoms (SoM of ligand) are preferentially hydroxylated (regionselectivity). The present results extend the extant literature also in that we found computed evidence why biological evolution can produce a plethora of mutations in the CYP family allowing the recognition of either many structurally unrelated endogeneous substrates or even xenobiotics by one and the same CYP isoform, while in the opposite way, a few enzymes (as in our case CYP2C9 and CYP3A4) share the same substrate or even the same hydroxylation pattern (here for PPC). During evolution the catalytic site of CYPs retains essentially the same chemical properties, regardless of the geometries, but the electronic conditions for the multi-step oxidation process are preserved. As a case in point, the proximal atom contacting the iron cation of the heme group is the terminal sulfur atom of the cysteine side chain which is characteristic for the entire CYP family (EC 1.14.13.48). The other indicator of evolutionary endeavor is the threonine (Thr301) located on α-helix I. Thr301 forms a hydrogen bond via the hydroxylated metabolite. It constitutes a unique residue since it is highly conserved what is not the case for all the other amino acids at the active site. Cytochrome P450 family enzymes have the same catalytic cycle for hydrocarbon hydroxylation 48. For this reason, the use of molecular mechanics force fields for SFR studies are sufficient to explain the enzyme kinetics data of the four CYPs on PPC.
Conclusions
Alluding to the title of the present molecular modeling study, all these “structure - function analysis” of experimentally determined facts about the “cytochrome p450 enzymes which are responsible of the phenprocoumon metabolism” we could elucidate with our calculations about binding energies and geometries at the catalytic sites. On a molecular level, our study identified functionally equivalent amino acids, which are not always located in conserved positions of amino acids sequences. They may also stem from different sequence locations but match (or align) in space to carry out the metabolic activity of the CYP enzymes. In an evolutionary dimension the fact that very low sequence homology leading to larger geometrical variations favors and develops the recognition of a huge variety of substrate structures, allows also a larger set of regioselectivities and SoM patterns for a given CYP, or inversely, various CYP isoforms may share the same substrate.
Acknowledgments
Israel Quiroga is grateful for both CONACyT grants (graduate studies of Master in Science and PhD degree) during 2013 to 2018.
References
1. 1. Gonzalez, F. J.; Tukey, R. H., in: The Pharmacological Basis of Therapeutics, 11 Ed., McGraw-Hill, New York, 2006, 71-91.
2. 2. Wöll, S.; Kim, S. H.; Greten, H. J.; Efferth, T. Nat Prod Bioprospect, 2013, 1-7.
3. 3. Brodie, E. D.; Ridenhour, B. J.; Brodie, E. D. Evolution, 2002, 56, 2067-2082.
4. 4. Handschin, C.; Meyer, U. A. Pharmacol. Rev, 2003, 55, 649-673.
5. 5. Bello, M.; Mendieta-Wejebe, J. E.; Correa-Basurto, J. Biochem Pharmacol, 2014, 90, 145-158.
6. 6. Mendieta-Wejebe, E. J.; Correa-Basurto, J.; Garcia-Segovia, E. M.; Ceballos-Cancino, G.; Rosales-Hernandez, M. C. Curr Drug Metab, 2011, 12, 533-548.
7. 7. Mendieta-Wejebe, J. E.; Rosales-Hernández, M. C.; Rios, H.; Trujillo-Ferrara, J.; López-Pérez, G.; Tamay-Cach, F.; Ramos-Morales, R.; Correa-Basurto, J. J Mol Model, 2008, 14, 537-545.
8. 8. Rosales-Hernández, M. C.; Mendieta-Wejebe, J. E.; Trujillo-Ferrara, J. G.; Correa-Basurto, V. Eur. J. Med. Chem, 2010, 45, 4845-4855.
9. 9. Vedani, A.; Smiesko, M. Altern Lab Anim, 2009, 37, 477-496.
10. 10. Vedani, A.; Dobler M.; Smieško, M. Toxicol Appl Pharmacol, 2012, 261, 142-153.
11. 11. Zaretzki, J.; Bergeron, C.; Rydberg, P.; Huang, T. W.; Bennett, K. P.; Breneman, C. M. J. Chem. Inf. Model, 2011, 51, 1667-1689.
12. 12. Martínez-Sotres C.; Rutiaga-Quiñones J. G.; Herrera-Bucio, R.; Gallo, M.; López-Albarrán, P. Wood Sci. Technol, 2015, 49, 857-868,
13. 13. Wester, M. R.; Johnson, E. F.; Marques-Soares, C.; Dijols, S.; Dansette, P. M.; Mansuy, D.; Stout, C. D. Biochemistry, 2003, 42, 9335-9345.
14. 14. Scott, E. E.; White, M. A.; He, Y. A.; Johnson, E. F.; Stout, C. D.; Halpert, J. R. J. Biol. Chem, 2004, 279, 27294-27301.
15. 15. Van Booven, D.; Marsh, S.; McLeod, H.; Carrillo, M. W.; Sangkuhl, K.; Klein, T. E.; Altman, R. B. Pharmacogenet Genomics, 2010, 20, 277.
16. 16. Pirmohamed, M.; Park, B. K. Toxicology, 2003, 192, 23-32.
17. 17. Lee, C. R.; Goldstein, J. A.; Pieper, J. A. Pharmacogenet Genomics, 2002, 12, 251-263.
18. 18. Ufer, M.; Kammerer, B.; Kahlich, R.; Kirchheiner, J.; Yasar, Ü.; Brockmöller, J.; Rane, A. Xenobiotica, 2004, 34, 847-859.
19. 19. Hirsh, J; Dalen, J. E.; Anderson, D. R.; Poller, L.; Bussey, H.; Ansell, J.; Deykin, D. Chest, 2001, 119, 8S-21S.
20. 20. He, M.; Korzekwa, K. R.; Jones, J. P.; Rettie, A. E.; Trager, W. F. Arch. Biochem. Biophys, 1999, 372, 16-28.
21. 21. Remko, M.; Broer, R.; Remková, A. RSC Adv., 2014, 4, 8072-8084.
22. 22. van Leeuwen, Y. in Towards Improvement, Ed. Gildeprint, 2009.
23. 23. Ufer, M.; Svensson, J. O.; Krausz, K. W.; Gelboin, H. V.; Rane, A.; Tybring, G. Eur. J. Clin. Pharmacol, 2004, 60, 173-182.
24. 24. Kammerer, B.; Kahlich, R.; Ufer, M.; Schenkel, A.; Laufer, S.; Gleiter, C. H. Anal Bioanal Chem, 2005, 383, 909-917.
25. 25. Kirchheiner, J.; Ufer, M.; Walter, E. C.; Kammerer, B.; Kahlich, R.; Meisel, C.; Schwab, M.; Gleiter, C. H.; Rane, A.; Roots, I.; Brockmöller, J. Pharmacogenet Genomics, 2004, 14, 19-26.
26. 26. Kirchmair, J.; Williamson, M. J.; Tyzack, J. D.; Tan, L.; Bond, P. J.; Bender, A.; Glen, R. C. J. Chem. Inf. Model, 2012, 52, 617-648.
27. 27. Nabuurs, S. B.; Wagener, M.; De Vlieg, J. J Med Chem, 2007, 50, 6507-6518.
28. 28. Berman, H. M.; Westbrook, J.; Feng, Z.; Gilliland, G.; Bhat, T. N.; Weissig, H.; Shindyalov, I.N.; Bourne, P. E. Nucleic Acids Res, 2000, 28, 235-242.
29. 29. Poulos, T. L.; Finzel, B. C.; Howard, A. J. J Mol Bio, 1987, 195, 87-700.
30. 30. Raag, R.; Poulos, T. L. Biochemistry, 1989, 28, 7586-7592.
31. 31. Wester, M. R.; Yano, J. K.; Schoch, G. A.; Yang, C.; Griffin, K. J.; Stout, C. D.; Johnson, E. F. J Biol Chem, 2004, 279, 35630-35637.
32. 32. Yano, J. K.; Wester, M. R.; Schoch, G. A.; Griffin, K. J.; Stout, C. D.; Johnson, E. F., J Biol Chem, 2004, 279, 38091-38094.
33. 33. Reynald, R. L.; Sansen, S.; Stout, C. D.; Johnson, E. F. J Biol Chem, 2012, 287, 44581-44591.
34. 34. Schoch, G. A.; Yano, J. K.; Sansen, S.; Dansette, P. M.; Stout, C. D.; Johnson, E. F., J Biol Chem, 2008, 285, 17227-17237.
35. 35. Pedretti, A.; Villa, L.; Vistoli, G. J Mol Graph Model, 2002, 21, 47-49.
36. 36. Williams, P. A.; Cosme, J.; Ward, A.; Angove, H. C.; Vinković, D. M.; Jhoti, H. Nature, 2003, 424, 464-468.
37. 37. Gasteiger, J.; Marsili, M. Tetrahedron, 1980, 36, 3219-3228.
38. 38. Hall, T. A. Nucleic Acids Symp Ser, 1999, 41, 95-98.
39. 39. Humphrey, W.; Dalke, A.; Schulten, K. J Mol Graph M, 1996, 14, 33-38.
40. 40. Studio, D. , version 4.0, San Diego: Accelrys. Inc, 2009.
41. 41. Morris, G. M.; Huey, R.; Lindstrom, W.; Sanner, M. F.; Belew, R. K.; Goodsell, D. S.; Olson, A. J. J. Comput. Chem, 2009, 30, 2785-2791.
42. 42. Vedani, A.; Huhta, D. W. J. Am. Chem. Soc, 1990, 112, 4759-4767.
43. 43. Sirim, D.; Widmann, M.; Wagner, F.; Pleiss, J. BMC Struct. Biol, 2010, 10, 34-46.
44. 44. Schoch, G. A.; Yano, J. K.; Wester, M. R.; Griffin, K. J.; Stout, C. D.; Johnson, E. F. J Biol Chem, 2004, 279, 9497-9503.
45. 45. Whitford, D. Proteins: structure and function, Sussex: John Wiley & Sons, 2013.
46. 46. Kaminsky, L. S.; Zhang, Z. Y. Pharmacol. Ther, 1997, 73, 67-74.
47. 47. Ufer, M. Clin Pharmacokinet, 2005, 44, 1227-1246.
48. 48. Ortiz de Montellano P. R. Chem Rev, 2010 110, 932-948.
Author notes
*Correspondence: quiroga.israel@gmail.com, +52 222 229 5500 Ext 7529
